How to Work Out SD on Excel: Easy & Essential Guide

Standard deviation (SD) measures how spread out your data is from the average. Learning how to work out SD on Excel is essential for anyone analyzing statistics, managing finances, or conducting research. Excel makes this calculation simple with built-in functions that handle complex math instantly. Whether you’re tracking sales figures, student test scores, or scientific measurements, mastering standard deviation in Excel will elevate your data analysis skills and help you make better decisions based on your data’s variability.
Quick Answer: Use the =STDEV() function for sample data or =STDEV.P() for population data. Select your data range, type the formula, and press Enter. Excel instantly calculates how much your values deviate from the mean, giving you insight into data consistency and reliability.
Tools & Materials You’ll Need
- Microsoft Excel (2010 or newer) or Google Sheets
- A dataset with numerical values
- Basic understanding of what standard deviation represents
- A computer with spreadsheet software installed
- Optional: Calculator for manual verification
Understanding Standard Deviation in Excel
Standard deviation quantifies the amount of variation or dispersion in a dataset. When you work out SD on Excel, you’re measuring how far individual data points typically fall from the mean (average). A small standard deviation indicates that values cluster closely around the average, while a large standard deviation suggests values are scattered widely.
In business contexts, understanding SD helps you assess risk and consistency. For example, if two products have the same average lifespan but different standard deviations, the one with lower SD is more reliable. Excel’s standard deviation functions automate this crucial statistical calculation, eliminating manual computation errors and saving valuable time.
Excel offers two primary standard deviation functions designed for different scenarios. The distinction between them is fundamental to accurate statistical analysis, so choosing the right one directly impacts your results’ validity and interpretation.

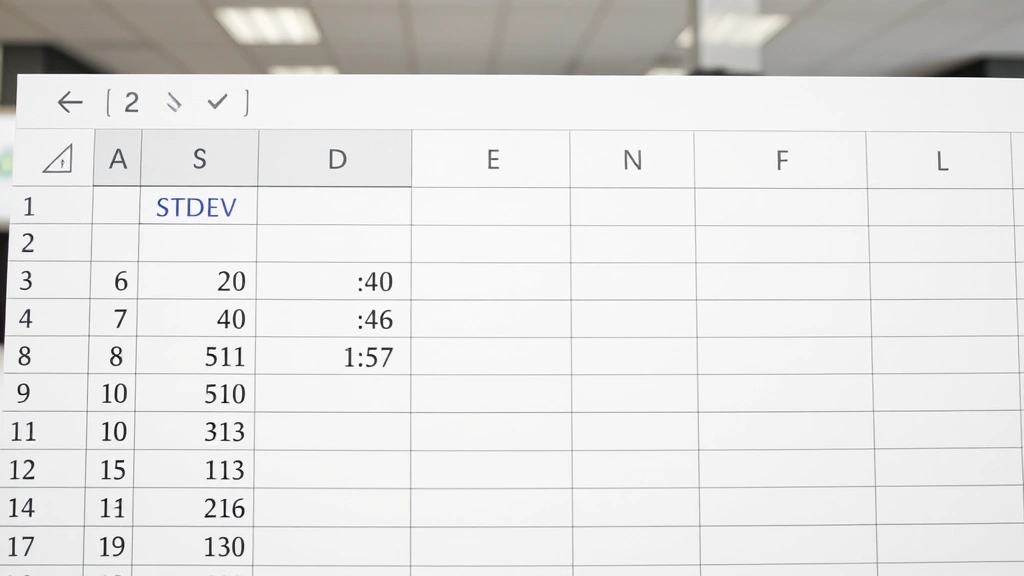
” alt=”Excel spreadsheet showing data range and standard deviation calculation formula” />
STDEV vs STDEV.P: Which Function to Use
STDEV() or STDEV.S() calculates the sample standard deviation, used when your data represents a portion of a larger population. This function divides by (n-1), where n is the number of values. Use this when analyzing survey responses, test scores from a classroom, or sales data from a specific region that represents a broader market.
STDEV.P() calculates the population standard deviation, appropriate when your dataset contains all possible values you’re studying. This function divides by n directly. Use population SD when analyzing an entire company’s employee salaries, all students in a specific grade, or complete historical data for a specific period.
The choice between these functions matters significantly. Sample standard deviation typically produces slightly larger values than population standard deviation because it accounts for sampling variability. According to WikiHow’s statistical guides, understanding this distinction is crucial for proper data interpretation in academic and professional settings.
Basic Steps to Calculate SD in Excel
Learning how to work out SD on Excel involves a straightforward process that even beginners can master. Start by organizing your numerical data in a single column or row, ensuring no empty cells interrupt the sequence. Excel’s functions work best with clean, contiguous data ranges.
- Enter your data into Excel cells (e.g., A1:A10)
- Click on an empty cell where you want the result displayed
- Type the formula: =STDEV(A1:A10) for sample data
- Press Enter to execute the calculation
- Review the result displayed in your selected cell
The formula bar at the top of Excel displays your complete formula, allowing verification before pressing Enter. This transparency helps prevent errors and makes your calculations auditable, which is essential when protecting important spreadsheets or sharing analyses with colleagues.
Working with Sample Data
Let’s work through a practical example of how to work out SD on Excel using realistic sample data. Imagine you’re analyzing monthly sales figures for a product line: $4,200, $4,500, $3,800, $5,100, and $4,400.
Enter these values in cells A1 through A5. In cell B1, type =STDEV(A1:A5) and press Enter. Excel instantly calculates the sample standard deviation as approximately $574.64. This result tells you that sales figures typically vary by about $575 from the average of $4,400.
You can enhance this analysis by adding dropdown lists for data entry, making your spreadsheet more professional and less error-prone. Additionally, consider using freezing panes when working with larger datasets to keep headers visible while scrolling through data.
For verification, you can manually calculate: find the mean ($4,400), subtract it from each value, square the differences, sum them, divide by (n-1), and take the square root. Excel’s formula delivers identical results in milliseconds, demonstrating why automation is invaluable for statistical work.
Advanced SD Techniques and Tips
Once you’ve mastered basic standard deviation calculations, several advanced techniques can enhance your Excel proficiency. Conditional standard deviation calculates SD for only values meeting specific criteria using array formulas or helper columns. This proves invaluable when analyzing subsets of larger datasets.
Use =STDEV(IF(range=criteria,values)) as an array formula (entered with Ctrl+Shift+Enter) to calculate SD for filtered data. For example, calculate standard deviation only for sales exceeding $4,000, or test scores above 80. This technique requires careful syntax but delivers powerful analytical insights.
Multiple standard deviation calculations across different data groups help compare variability. Create a summary table showing mean and SD for each product line, region, or time period. This comparison reveals which segments have consistent performance versus those with volatile results, informing strategic decisions.
Combine standard deviation calculations with finding duplicates in Excel to ensure data quality before statistical analysis. Duplicate values can skew standard deviation results, so cleaning your dataset first is essential. You might also consider password protecting your Excel file when working with sensitive statistical data.
Create a dynamic range using the OFFSET function so your SD formula automatically adjusts when you add new data. This approach eliminates manual formula updates and ensures your analysis stays current with fresh information.
Troubleshooting Common Errors
When learning how to work out SD on Excel, you’ll likely encounter common errors. #DIV/0! error appears when your data range contains fewer than two values, since standard deviation requires multiple data points. Ensure your range includes at least two numerical values.
#VALUE! error occurs when your range contains text, blank cells, or non-numeric values. Excel’s standard deviation functions only process numbers. Review your data range carefully, removing any text entries or empty cells that might disrupt the calculation. You can use data validation to prevent these issues in future entries.
Unexpected results often stem from choosing the wrong function. Remember: STDEV() for samples, STDEV.P() for populations. Using sample SD on population data or vice versa produces mathematically correct but contextually wrong results. Double-check which function matches your data scenario before relying on results.
Hidden rows or columns can cause confusion when calculating SD. If your formula references a range containing hidden data, Excel still includes those values in the calculation. If you want to exclude hidden data, use AGGREGATE function instead: =AGGREGATE(7,5,A1:A10) where 7 represents STDEV and 5 means ignore hidden rows.
According to HowStuffWorks’ technical guides, careful attention to formula syntax prevents most calculation errors. Always verify your formula references the correct range and uses appropriate function names for your Excel version.
Real-World Applications of SD Calculations
Standard deviation calculations extend far beyond academic exercises. In quality control, manufacturers use SD to monitor production consistency. If a machine produces widgets with increasing standard deviation, it signals maintenance needs before quality deteriorates significantly. Tracking SD over time reveals equipment degradation patterns.
Financial analysis relies heavily on standard deviation as a volatility measure. Investment portfolios with high SD are riskier; those with low SD are more stable. Financial analysts use SD to assess stock performance, bond yields, and market indices. When comparing investment options, SD helps quantify risk beyond simple return percentages.
Human resources departments use SD to analyze salary distributions, ensuring fair compensation across departments and experience levels. High SD in salary data might indicate inconsistent compensation practices requiring review. SD analysis helps identify pay equity issues and guides salary standardization efforts.
Healthcare providers monitor patient outcome variability using standard deviation. If treatment outcomes show high SD, some patients respond excellently while others show minimal improvement, suggesting the need for personalized treatment approaches. Low SD indicates consistent, predictable outcomes across the patient population.
Marketing teams analyze campaign performance using SD. Email open rates, click-through rates, and conversion rates with low SD indicate reliable, consistent campaign performance. High SD suggests unpredictable results, prompting investigation into variables affecting performance consistency.
As noted by The Spruce’s practical guides, understanding statistical measures like standard deviation empowers better decision-making across all professional fields. Learning how to work out SD on Excel provides a foundation for data-driven analysis in your specific industry or role.
FAQ
What’s the difference between standard deviation and variance?
Variance is the square of standard deviation. While variance is mathematically convenient, standard deviation is more interpretable because it’s expressed in the same units as your original data. If analyzing heights in inches, standard deviation is in inches; variance would be in square inches.
Can I calculate standard deviation for non-numeric data?
No, standard deviation requires numerical values. Text, dates, and categorical data cannot be directly analyzed using STDEV functions. However, you can assign numeric codes to categories and analyze those, though the statistical validity depends on your coding scheme’s appropriateness.
How many data points do I need for reliable standard deviation?
While Excel calculates SD with just two values, statisticians generally recommend at least 30 data points for reliable analysis. Smaller samples produce less stable SD estimates. The larger your dataset, the more confident you can be in your standard deviation as a true representation of variability.
Should I use STDEV or STDEV.S?
They’re identical in modern Excel versions. STDEV.S is the newer, more explicit name indicating sample standard deviation. Both produce the same results, so use whichever your version supports. STDEV.S is preferable in newer versions for clarity.
How do I interpret a standard deviation result?
In a normal distribution, approximately 68% of values fall within one standard deviation of the mean, 95% within two standard deviations, and 99.7% within three. If your mean is 100 and SD is 15, you’d expect most values between 85-115, with occasional values beyond this range.
Can standard deviation be negative?
No, standard deviation is always zero or positive. It measures distance from the mean, and distance cannot be negative. A standard deviation of zero indicates all values are identical (no variation). Any positive SD indicates data variation.
What if my data contains outliers?
Standard deviation is sensitive to outliers, which can inflate the result significantly. If you suspect outliers are distorting your analysis, consider using median absolute deviation (MAD) instead, or investigate whether outliers represent data entry errors or legitimate extreme values worth understanding separately.
How do I calculate rolling standard deviation?
Use a formula like =STDEV(OFFSET(A1,ROW()-ROW($A$1),0,5,1)) to calculate SD for a moving window of five values. This technique reveals how variability changes over time, useful for trend analysis in time-series data like stock prices or weather patterns.