Your CPU is running hot—literally. And if you don’t know how to know the temp of cpu, you’re flying blind. A processor that’s too hot doesn’t just slow down your PC; it can damage components, shorten lifespan, and turn your machine into a paperweight. The good news? Checking CPU temperature is straightforward once you know where to look.
I’ve been building and troubleshooting PCs for years, and temperature monitoring is one of those “unsexy” tasks that separates people who keep their rigs running for a decade from those who fry their hardware in three years. Let’s walk through the real, practical ways to monitor your CPU temperature and what the numbers actually mean.
Why CPU Temperature Matters
Think of your CPU like an engine. Push it too hard without cooling, and it seizes up. Modern processors have thermal throttling built in—they’ll automatically slow themselves down if they get too hot. But that’s a band-aid, not a solution. When your CPU throttles, you lose performance. Games stutter. Video rendering crawls. Compiling code takes forever.
Worse, sustained high temperatures degrade silicon over time. We’re talking about electrons literally moving through microscopic transistors billions of times per second. Heat accelerates that wear. A CPU that runs at 95°C for years will fail sooner than one that stays at 65°C.
Here’s the real-world scenario: You’re gaming or rendering video, your CPU hits 100°C, and suddenly your system shuts down. That’s the built-in protection kicking in. It’s better than a fried CPU, but it’s also a sign something’s wrong—usually dust buildup, a failing cooler, or inadequate airflow in your case.
Pro Tip: Check your CPU temperature regularly, not just when you’re worried. Baseline monitoring helps you spot problems early. If temps suddenly jump 15-20°C without explanation, that’s your warning light.
What Temperature Ranges Are Safe?
CPU temperature safety depends on your processor. Intel and AMD give different specs, and older chips have different limits than new ones. But here’s a practical breakdown:
- Idle (40-50°C): Your CPU at rest. If it’s above 55°C while idle, something’s wrong—usually a background process or a cooler that’s not making good contact.
- Light Load (50-70°C): Browsing, office work, light gaming. This is your sweet spot for daily use.
- Heavy Load (70-85°C): Gaming, video editing, compiling. Most modern CPUs handle this fine, but sustained temps above 85°C mean your cooling isn’t keeping up.
- Thermal Throttling (85-100°C): Your CPU is reducing performance to protect itself. This is a warning. Keep going and you risk shutdown.
- Critical (100°C+): Danger zone. Automatic shutdown is likely imminent.
Intel’s 12th and 13th gen chips (like the i9-13900K) can handle higher sustained temperatures than older models. AMD’s Ryzen processors are similar. But don’t use “it can handle it” as an excuse to ignore temps. Just because a CPU can theoretically run at 100°C doesn’t mean you should let it.
Best Software Tools to Check CPU Temp
This is where most people start. Software monitoring is easy, free, and gives you real-time data. Here are the tools I actually use and recommend:
HWiNFO64 (Windows)
HWiNFO64 is the gold standard. It reads sensor data directly from your motherboard and CPU, showing temperature, clock speeds, voltage, and power draw. Download it from hwinfo.com, run it, and you’ll see everything in real time. The interface looks like something from 1998, but it’s bulletproof reliable. No bloat, no ads, no nonsense.
To use it: Launch HWiNFO64, check the “Sensors Only” option, and click Start. Look for your CPU in the list—it’ll show individual core temperatures. Intel CPUs display “Package” (overall) and per-core temps. AMD shows similar data. Pin this window to your taskbar and check it whenever you’re doing heavy work.
Core Temp (Windows)
Lightweight and simple. Core Temp focuses solely on CPU temperature, showing each core individually. It’s perfect if you want minimal overhead and don’t need GPU or storage info. Grab it from alcpu.com.
Afterburner (Windows & Mac)
MSI Afterburner is designed for GPU overclocking, but it also monitors CPU temps beautifully. The on-screen display (OSD) overlay is perfect for gaming—you can see temps without alt-tabbing. It’s free even if you don’t own an MSI card.
Macs: Macs Fan Control
Apple doesn’t make it easy to check temps on Macs, but Macs Fan Control gets the job done. It shows CPU temperature, fan speeds, and lets you manually adjust cooling if needed. Download from crystalidea.com.
Linux: lm-sensors
On Linux, install lm-sensors and run sensors in the terminal. It’ll display CPU temperature and other sensor data. If you want a GUI, use HardInfo or psensor.
Real Talk: Don’t install ten different monitoring tools. Pick one, learn it, stick with it. Too many tools fighting for sensor data can cause conflicts or false readings.
Checking Temperature in BIOS
BIOS monitoring is the most direct method because you’re reading data straight from the hardware without any operating system in between. Here’s how:
- Restart your PC.
- Enter BIOS. During startup, press Delete, F2, F12, or Esc (varies by manufacturer). Look for the prompt on the boot screen.
- Navigate to Hardware Monitor or System Information. The exact name depends on your motherboard (ASUS, MSI, Gigabyte, etc.), but it’s usually under a menu called “Monitor,” “Health,” or “System.”
- Find CPU Temperature. It’ll be labeled as “CPU Temp” or “Package Temp.” Some boards show individual core temps too.
- Note the reading and exit. Press Esc or select “Exit” to leave BIOS and boot normally.
The advantage of BIOS checking is accuracy—you’re seeing raw sensor data. The disadvantage is you can only check it at startup, not during heavy load. Use BIOS to verify your baseline temperature at idle, then use software tools to monitor during actual use.
Windows Monitoring Methods
Beyond dedicated tools, Windows has built-in options:
Task Manager (Limited, But Available)
Windows 11 added CPU temperature to Task Manager. Open Task Manager (Ctrl+Shift+Esc), go to the Performance tab, click CPU, and scroll down. You’ll see “Temperature” listed. It’s basic, but it works. Windows 10 doesn’t have this feature, so you’ll need third-party tools.
PowerShell (Advanced)
If you’re comfortable with command line, PowerShell can pull temperature data from WMI (Windows Management Instrumentation). Run this command:
Get-WmiObject -Namespace "root\wmi" -Class MSAcpi_ThermalZoneTemperature
It’ll show temperature in tenths of Kelvin. Subtract 273.15 and divide by 10 to get Celsius. Honestly, this is overkill for most people—just use HWiNFO64.
Event Viewer Warnings
If your CPU is overheating and throttling, Windows logs events in Event Viewer. Open Event Viewer (type it in the search bar), go to Windows Logs > System, and look for warnings or errors mentioning “thermal” or “throttling.” This is a reactive check—it tells you problems already happened—but it’s useful for diagnosis.
Mac and Linux Solutions
Mac Monitoring
Macs are frustrating for temperature checking because Apple doesn’t expose this data easily. Your options:
- Macs Fan Control: The easiest solution. Shows CPU temp, GPU temp, and fan speeds. Free version is sufficient.
- Coconut Battery: Older tool, still works. Focuses on battery health but shows some thermal data.
- Terminal Command: Run
sudo powermetrics --samplers cpu_power | grep "CPU die temperature"in Terminal. Requires admin password but gives accurate readings.
Mac CPUs generally run cooler than Windows machines because of tight hardware integration, but if your MacBook fan is screaming, something’s wrong. Check Activity Monitor (Applications > Utilities > Activity Monitor) to see if a process is hogging CPU resources.
Linux Monitoring
Linux users have the most flexibility. Install lm-sensors:
sudo apt-get install lm-sensors (Ubuntu/Debian)
sudo pacman -S lm-sensors (Arch)
sudo dnf install lm_sensors (Fedora)
Then run sensors to see all temperatures. For a GUI, install psensor or hardinfo. Linux gives you direct hardware access, so readings are typically very accurate.
Troubleshooting High Temperatures
So you’ve checked your CPU temperature and it’s running hot. Here’s what to do:
Step 1: Verify the Reading Is Real
Use two different tools. If HWiNFO64 and Core Temp both show 85°C at idle, it’s real. If only one tool shows it, there might be a sensor error. Also check BIOS—if BIOS shows normal temps but software shows high temps, the software reading is likely false.
Step 2: Check for Background Processes
Open Task Manager (Ctrl+Shift+Esc) and sort by CPU usage. Windows Update, antivirus scans, or malware can spike CPU temps. If a process is using 30%+ CPU at idle, that’s your culprit. Disable scheduled tasks or run a malware scan.
Step 3: Clean the Cooler and Case
Dust is the #1 cause of high CPU temps. If your cooler fan is clogged with dust, air can’t flow through the fins. Here’s what to do:
- Power off and unplug the PC.
- Open the case.
- Use compressed air to blow dust out of the cooler fins. Hold the fan still so it doesn’t spin—spinning a fan without power can damage bearings.
- Clean the case fans too. Check your case intake and exhaust fans for dust buildup.
- Close the case and test temps again.
Nine times out of ten, this fixes the problem. Dust is invisible until you look, but it’s a thermal insulator. It traps heat instead of letting it dissipate.
Step 4: Check Cooler Contact
If cleaning didn’t help, the cooler might not be making good contact with the CPU. This is more common after moving a PC or after a year or two of use as thermal paste degrades.
Signs of poor contact: Idle temps are 10-15°C higher than normal for your system, or temps spike wildly under load. To fix it:
- Power off and unplug.
- Remove the cooler (follow your cooler’s manual—different types have different mounting).
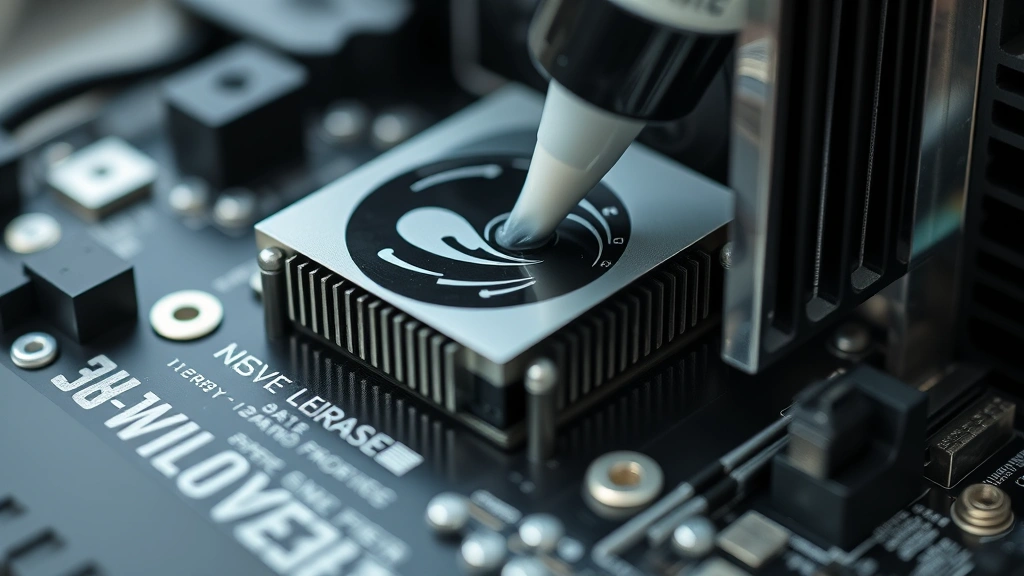
- Clean the old thermal paste off the CPU with isopropyl alcohol and a lint-free cloth.
- Apply a small pea-sized amount of fresh thermal paste to the center of the CPU.
- Reinstall the cooler, making sure it’s mounted evenly and tightened properly.
- Test temps.
Safety Warning: When working inside a PC, always power off, unplug, and touch a metal part of the case to discharge static electricity. Thermal paste is non-conductive, but static can kill components.
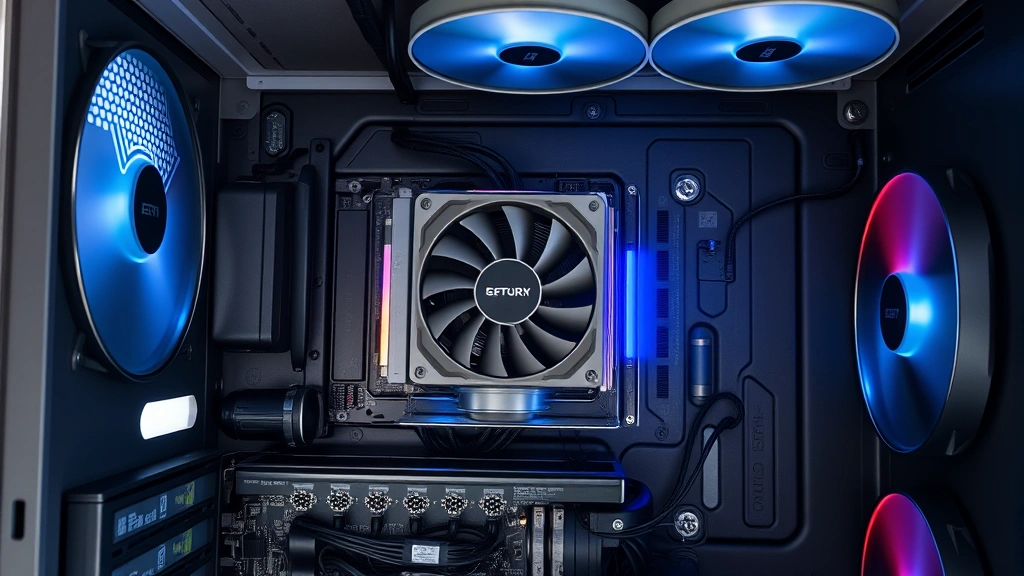
Step 5: Improve Case Airflow
If your case has poor airflow, even a good cooler struggles. Check:
- Intake fans: Are they clear of obstructions? Is the case sitting on a surface that blocks air intake?
- Exhaust fans: Do you have at least one exhaust fan pulling hot air out?
- Cable management: Messy cables block airflow. Route them behind the motherboard tray or use cable ties.
- Cooler orientation: For tower coolers, the fan should pull air from the front/bottom and exhaust toward the back/top of the case.
If your case only has one fan, add a second one for exhaust. A $15 case fan is cheaper than replacing a CPU.
Step 6: Consider a Better Cooler
If you’re using the stock cooler that came with your CPU, it’s probably adequate but not great. If you’ve cleaned everything and temps are still high under heavy load, upgrade to an aftermarket cooler. Popular options include Noctua NH-D15, be quiet! Dark Rock Pro 4, or AIO liquid coolers like NZXT Kraken or Corsair iCUE.
Match the cooler to your CPU’s TDP (Thermal Design Power). A high-end i9 needs a beefy cooler; a Ryzen 5 is fine with a mid-range tower cooler.
Step 7: Check for Thermal Paste Degradation
Thermal paste degrades over time, especially if your CPU runs hot regularly. If your system is 3+ years old and you’ve never reapplied paste, that’s likely the issue. Replace it following the steps in Step 4 above.
Frequently Asked Questions
What’s the difference between CPU temperature and core temperature?
– CPU temperature (or Package temperature) is the overall temperature of the processor. Core temperature is the temperature of individual cores. Modern CPUs have multiple cores, and they can run at slightly different temps. Most tools show both. Watch the Package temp for overall health; core temps help identify if one core is hotter than others (which might indicate mounting issues).
Is 80°C safe for gaming?
– Yes, 80°C is safe for gaming on modern CPUs. It’s warm, but not dangerous. Most processors are rated for sustained operation up to 95-100°C. That said, if your CPU is hitting 80°C while gaming, your cooler is working hard. If it hits 90°C+, consider improving cooling. For longevity, aim to keep gaming temps under 85°C.
Can I trust the temperature reading in HWiNFO64?
– Yes, HWiNFO64 reads directly from your motherboard’s sensors, so it’s very accurate. The only caveat: some cheap motherboards have poorly calibrated sensors. If HWiNFO64 shows 50°C at idle but BIOS shows 35°C, the BIOS reading is likely more accurate. In that case, there’s a sensor offset issue—not a problem, just something to be aware of.
Why is my CPU temp different in BIOS vs. software?
– BIOS and software read the same sensors, but software adds a small delay as data travels through the operating system. Usually the difference is 1-3°C and not significant. If the difference is 10°C+, one reading is likely wrong. Check both tools again and trust the BIOS reading—it’s more direct.
Should I worry about my CPU temperature if I’m not gaming or doing heavy work?
– Not obsessively, but check it occasionally. Idle temps should be 35-50°C depending on room temperature and cooler. If idle temps are 60°C+, something’s consuming CPU resources (check Task Manager) or your cooler isn’t working properly. For normal use, temps aren’t a concern if they’re in safe ranges.
What’s the best way to monitor CPU temperature long-term?
– Use HWiNFO64 or Core Temp and check temps during normal use every week or two. Keep a mental baseline (“my CPU usually hits 75°C when gaming”). If temps suddenly jump 15-20°C without explanation, investigate. Also check temps after cleaning your PC—you’ll see the improvement. For continuous monitoring, some tools like HWiNFO64 can log data to a file, which is useful for spotting trends.
Can high CPU temperature damage my motherboard?
– Directly, no. The CPU has its own thermal limit. But sustained high CPU temps can affect nearby components like VRM (voltage regulation modules) on the motherboard, which can reduce their lifespan. Also, if your CPU is overheating, it’s usually due to poor airflow, which affects your whole system. Check your motherboard for damage if you suspect thermal issues—see our guide on how to check motherboard damage from GPU for inspection tips that apply to thermal damage too.
I’m overclocking my CPU. What temperatures should I aim for?
– When overclocking, keep your CPU under 80°C under load. Overclocked chips run hotter because you’re increasing voltage and clock speed. If you’re hitting 90°C+ while overclocking, you’re pushing too hard or your cooler isn’t adequate. Back off the clock speed or voltage and test again. Also, ensure you have good case airflow—overclocking amplifies cooling demands.
Why does my CPU temperature spike when I open a program?
– That’s normal. When you launch a program, especially something like a game or video editor, the CPU goes from idle to heavy load. Temps spike as the processor works harder. As long as temps stabilize after a few seconds and don’t exceed safe ranges, it’s fine. If temps keep climbing indefinitely, you have a cooling problem.
Is liquid cooling better than air cooling for temperature control?
– Liquid cooling (AIO or custom loop) can be slightly better at dissipating heat, but a good air cooler performs nearly as well. The difference is often just 2-5°C. Liquid coolers are more expensive, require maintenance, and can fail (pump dies, liquid leaks). For most users, a quality air cooler is the better choice. Liquid cooling makes sense if you’re overclocking heavily or want the aesthetics.
Can I check CPU temperature on a laptop?
– Yes, use the same software tools (HWiNFO64 on Windows, Macs Fan Control on Mac). Laptops typically run hotter than desktops because of limited space and airflow. Temps above 85°C on a laptop are common under load, but if your laptop is hitting 95°C regularly, the cooler needs cleaning or the thermal paste needs replacing. Laptops are harder to service, so consider professional cleaning if you’re uncomfortable opening it.
For more PC maintenance tips, check out how to clear disk space on Mac and optimize your system performance overall. You might also want to explore how to allocate more RAM to Minecraft if you’re a gamer looking to reduce CPU load in specific applications.
Final Thoughts
Knowing how to know the temp of cpu is fundamental PC maintenance. It takes five minutes to download a tool and check your baseline temperature. Doing it regularly—even just once a month—catches problems before they become expensive disasters.

The reality: most people ignore CPU temperature until something breaks. Then they’re replacing a $300-500 processor. Spend a few minutes now, establish a baseline, and you’ll avoid that mess. Use HWiNFO64 or Core Temp, check your temps during normal use and gaming, and if anything looks wrong, troubleshoot methodically starting with cleaning and cooler contact.
Your CPU will thank you, and your PC will run faster and last longer. That’s not overkill—that’s just good maintenance.