How to Check CPU Temperature: Essential & Easy Guide

Your CPU temperature is critical to your computer’s health and performance. Overheating can cause system crashes, data loss, and permanent hardware damage. Learning how to check CPU temperature takes just minutes and gives you complete peace of mind about your machine’s thermal status. Whether you’re a casual user or a PC enthusiast, monitoring your processor temperature should be part of your regular maintenance routine.
Quick Answer: Use free software like HWiNFO, Core Temp, or CPU-Z to monitor CPU temperature in real-time. On Windows, open the app, locate the temperature reading (usually in Celsius), and note the current, minimum, and maximum values. Mac users can try Macs Fan Control or Temp Monitor. Ideal CPU temperatures range from 30-60°C at idle and under 80°C during heavy use. Check your system every few weeks to catch thermal issues early.
Tools & Materials You’ll Need
- Computer with Windows, Mac, or Linux operating system
- Internet connection to download monitoring software
- Administrator access to install applications
- Free CPU monitoring software (HWiNFO, Core Temp, CPU-Z, or equivalent)
- Optional: Thermal paste (if you plan to clean your cooler)
- Optional: Compressed air (for dust removal from heatsinks)
- Optional: Thermal imaging camera (for advanced diagnostics)
Why You Should Monitor CPU Temperature
Your CPU generates heat as it processes data, and excessive heat is one of the most common causes of computer problems. When your processor overheats, it automatically throttles performance to reduce heat generation—meaning your computer slows down dramatically. In extreme cases, thermal protection mechanisms shut down your entire system to prevent damage.
Checking how to check CPU temperature regularly helps you identify cooling problems before they become serious. Early detection of rising temperatures can save you hundreds of dollars in repair costs. Additionally, consistent monitoring gives you baseline data to track changes over time, helping you notice when your cooling system needs maintenance.
Understanding Safe Temperature Ranges
Safe CPU temperatures vary by processor model, but general guidelines apply: Most modern CPUs are designed to operate safely up to 90-100°C, but optimal performance occurs at much lower temperatures. At idle (when your computer is running but not performing intensive tasks), your CPU should stay between 30-50°C. During moderate use like web browsing or document editing, temperatures typically range from 50-70°C.
When running demanding applications—gaming, video editing, 3D rendering, or stress testing—temperatures between 70-85°C are normal and acceptable. However, consistently running above 85°C shortens your CPU’s lifespan and risks automatic throttling. If you see temperatures above 90°C during normal use, your cooling system needs attention immediately. According to WikiHow’s comprehensive guides, monitoring these ranges prevents most thermal-related issues.

” alt=”CPU temperature monitoring dashboard on computer screen”>
How to Check CPU Temperature on Windows
Windows doesn’t include a built-in CPU temperature monitor in Settings, so you’ll need third-party software. The most popular and reliable option is HWiNFO, a comprehensive system monitoring tool that displays detailed thermal information.
Using HWiNFO: Download HWiNFO from the official website and run the installer. Launch the application and look for the “Sensors” window. Scroll down to find your CPU listed by model name (Intel Core i7, AMD Ryzen 5, etc.). You’ll see multiple temperature readings—focus on the “Package” or “CPU Package” temperature, which represents your overall processor heat. The software displays current, minimum, and maximum temperatures since you opened the application.
Using Core Temp: This lightweight alternative specifically focuses on CPU temperature. Install Core Temp, and it immediately displays each core’s temperature in the system tray. Right-click the tray icon to see detailed information including your processor model, TDP (thermal design power), and individual core temperatures. Core Temp is particularly useful because it shows temperature variations across different processor cores.
Using CPU-Z: While primarily a CPU identification tool, CPU-Z includes a temperature tab. Open the application, click the “CPU Package” or similar temperature reading, and monitor real-time values. This tool is excellent for quick checks without installing heavyweight monitoring software.
How to Check CPU Temperature on Mac
Mac computers don’t display CPU temperature in System Preferences, requiring third-party solutions. Apple intentionally limits thermal monitoring to maintain a streamlined user experience, but several reliable applications fill this gap.
Using Macs Fan Control: Download and install Macs Fan Control, which provides real-time CPU temperature alongside fan speed control. The application displays temperatures in Celsius and includes a history graph showing thermal trends over time. This is particularly valuable for MacBook owners who want to optimize fan performance and prevent overheating.
Using Temp Monitor: This simple, lightweight application sits in your menu bar and constantly displays your CPU temperature. Click the menu bar icon to see detailed information about each processor core. Temp Monitor works on both Intel and Apple Silicon Macs, making it universally compatible.
Using iStat Menus: A more comprehensive system monitoring solution, iStat Menus displays CPU temperature alongside RAM usage, disk activity, and network speed. While it’s a paid application, the detailed insights justify the cost for power users and professionals who need comprehensive system monitoring.
How to Check CPU Temperature on Linux
Linux offers multiple command-line and graphical tools for checking CPU temperature. The advantage of Linux is that many temperature monitoring tools come pre-installed or are easily available through package managers.
Using sensors command: Open Terminal and type sensors to display real-time temperature readings from your system’s sensors. This command requires the lm-sensors package, which you can install using your distribution’s package manager. The output shows temperatures for your CPU, GPU, and other components in an organized format.
Using watch command with sensors: For continuous monitoring, type watch sensors to refresh temperature readings every two seconds. This is ideal for stress testing or observing how temperatures change during intensive tasks.
Using graphical tools: GNOME System Monitor and KDE System Monitor provide graphical interfaces for temperature monitoring. These tools are often pre-installed on Ubuntu, Fedora, and other popular distributions. Simply search for “System Monitor” in your applications menu and navigate to the Sensors or Performance tab.
How to Interpret Your Temperature Readings
When you check how to check CPU temperature, you’ll encounter several types of readings that require interpretation. The “Package” or “CPU Package” temperature represents the overall processor temperature and is the most important number to monitor. Individual core temperatures show heat distribution across processor cores—some variation between cores is normal, but significant differences (more than 15°C) might indicate cooling problems.
Junction temperature is another critical reading—this represents the hottest spot on your CPU die. Your processor’s specifications include a maximum junction temperature (Tjunction or Tmax), usually between 90-110°C depending on the model. Staying well below this threshold ensures longevity and stable performance. According to HowStuffWorks, understanding these distinctions prevents misinterpretation of thermal data.
Pay attention to temperature trends over time. A gradual increase in idle temperatures over weeks or months indicates dust accumulation in your cooler or degraded thermal paste. Sudden temperature spikes during normal use suggest cooling system failure or software issues. Most monitoring software includes graphing features that visualize these trends, making pattern recognition easy.
Troubleshooting High CPU Temperature
If you discover your CPU runs hotter than safe ranges, systematic troubleshooting identifies the root cause. Start by checking your room temperature and ambient conditions. Computers in hot environments naturally run warmer. If your room is above 30°C, this partially explains elevated CPU temperatures.
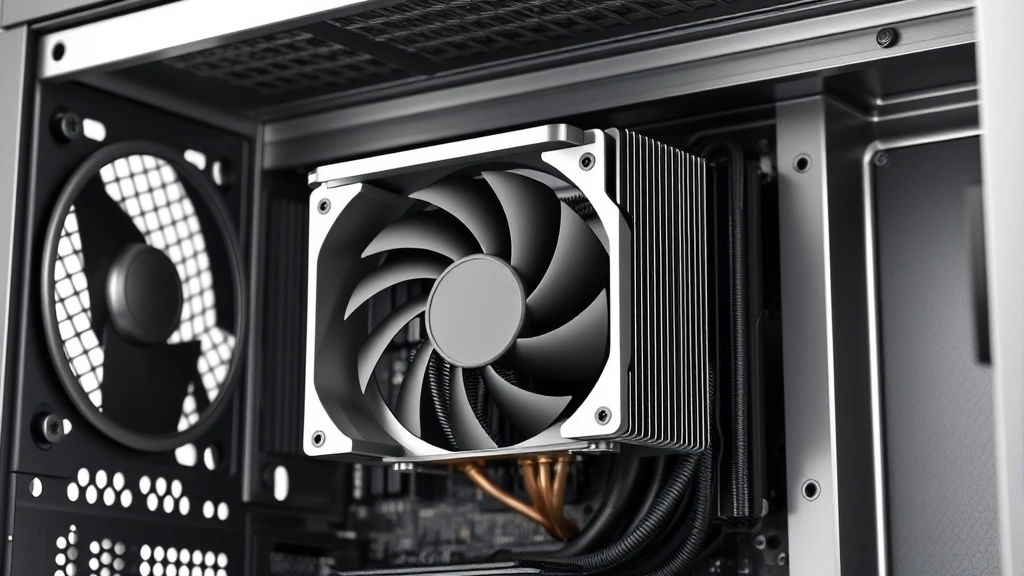
Next, examine your cooling system physically: Power down your computer completely and open the case (if you’re comfortable doing so). Look for dust accumulation on your heatsink and fan. Dust acts as insulation, trapping heat and preventing efficient cooling. Use compressed air to gently blow dust away from cooling fins—hold the can upright and use short bursts to avoid damaging components.
Check that your CPU cooler is properly seated and mounted. If you recently moved your computer or it’s been in storage, the cooler might have shifted. Ensure all mounting brackets are tight and the cooler makes full contact with the CPU. If thermal paste looks dry or crusty, consider replacing it with fresh thermal paste. As reviewed by Family Handyman, proper thermal paste application is crucial for heat transfer.
Software issues also cause apparent overheating: Background processes consuming CPU resources generate excessive heat. Open your Task Manager (Windows) or Activity Monitor (Mac) and check for runaway processes using abnormally high CPU percentages. Malware infections, cryptocurrency miners, and outdated drivers frequently cause this problem. Update your graphics drivers and BIOS to the latest versions, as manufacturers often release thermal optimization updates.
Consider upgrading your cooler if temperatures remain high after cleaning and verification. Aftermarket coolers like Noctua, Be Quiet, or Corsair liquid coolers dramatically improve thermal performance compared to stock coolers. This upgrade is particularly valuable if you plan to overclock or run demanding applications regularly.
Regular Maintenance to Keep Temperatures Optimal
Preventive maintenance keeps your CPU cool and extends your computer’s lifespan. Establish a monthly routine of checking temperatures using your preferred monitoring software. Create a simple log noting idle and load temperatures—this baseline data helps you notice gradual degradation before it becomes critical.
Clean your computer’s interior every 3-6 months, depending on your environment. Dusty homes, workshops, and pet-filled spaces require more frequent cleaning. Use compressed air to clean heatsinks, fans, and intake filters. Ensure your case has adequate airflow—don’t block intake or exhaust vents with furniture or clutter.
Replace thermal paste every 2-3 years if you haven’t opened your case recently. Thermal paste degrades over time, losing effectiveness and allowing temperatures to creep upward. This simple maintenance task takes 30 minutes and costs under $10. If you’re uncomfortable doing this yourself, many computer repair shops handle it affordably.
Monitor your CPU temperature during demanding tasks to understand normal operating ranges for your specific system. If you game, edit video, or run 3D applications regularly, knowing your maximum safe temperature helps you optimize performance settings. Some users deliberately keep temperatures lower by running fans at higher speeds, accepting increased noise for better longevity.
Update your BIOS and drivers regularly, as manufacturers release thermal optimization updates alongside performance improvements. Check your motherboard manufacturer’s website quarterly for BIOS updates and your GPU manufacturer’s website for driver updates. These updates often include thermal management improvements that reduce temperatures without sacrificing performance.
FAQ
Q: What is a normal CPU temperature?
A: Normal idle temperatures range from 30-50°C, while load temperatures between 70-85°C are acceptable. Your specific normal range depends on your CPU model, cooler type, and ambient temperature. Check your processor’s specifications for its maximum safe temperature.
Q: Can I check CPU temperature without downloading software?
A: Windows and Mac don’t include built-in temperature monitoring in their standard settings. You must use third-party software. However, some motherboards display temperatures in the BIOS during startup—press Delete or F2 during boot to access this information.
Q: Why is my CPU temperature different in different applications?
A: Different applications stress your CPU differently. Games and video rendering use CPU resources intensively, generating more heat than web browsing. This variation is completely normal and expected.
Q: Should I be worried about temperature fluctuations?
A: Minor fluctuations of 5-10°C are normal as your system adjusts to workload changes. Larger swings or rapid spikes might indicate cooling system problems or software issues requiring investigation.
Q: Is it safe to run my CPU at maximum temperature limits?
A: While your CPU won’t immediately fail at maximum rated temperatures, consistently running near these limits significantly reduces lifespan. Aim to keep temperatures 10-20°C below maximum specifications for optimal longevity.
Q: Can overclocking safely if I monitor temperature?
A: Temperature monitoring is essential for safe overclocking, but it’s not sufficient alone. You also need stable voltage settings, adequate cooling, and thorough stress testing. Only overclock if you understand the risks and have researched your specific CPU model.
Q: What should I do if my CPU temperature is 100°C or higher?
A: Shut down your computer immediately. Running at these temperatures causes permanent damage. After powering down completely, investigate cooling system failures, dust accumulation, or thermal paste degradation. Don’t restart until you’ve identified and resolved the problem.
Learning how to check CPU temperature is one of the most valuable skills for computer maintenance. Regular monitoring catches problems early, prevents costly repairs, and extends your system’s lifespan. Whether you choose HWiNFO, Core Temp, or any other monitoring tool, the key is consistency—check your temperatures monthly and investigate any unusual readings immediately. Your computer’s thermal health directly impacts performance and reliability, making this simple habit worth establishing today. For more detailed system maintenance guidance, consult The Spruce and Consumer Reports for comprehensive reviews and recommendations.